An online news item appearing on 15 October 2018 proclaims that “Americans don’t just disagree on the issues. They disagree on what the issues are.” The article, by Dylan Scott on the Vox website, reports on a poll conducted by the Pew Research Center, involving registered voters in the U.S., between 24 September and 7 October. Polarizing disagreement is a recurring theme in the world, and keeping the tension up sells ads, so it is not surprising to see the emphasis in both the article and in the Pew report on major differences in people’s perceptions of what counts as a “very big” problem in the U.S. today. But a closer look at the data gives hope for finding ways to communicate across barriers that may look more significant than they actually are.
There’s no mention in the article of the sampling error, uncertainty, or confidence level, but the Pew site indicates that, overall, sampling error is 1.5%. But the Vox article mentions only the total sample size and fails to say that the registered voter portion of the respondents is smaller by a couple of thousand. Further, the sampling error jumps up to 2.6% for respondents indicating support for a Republican candidate, and to 2.3% for respondents supporting a Democrat. Again, the differences being played up are quite large, so there’s little risk of making too much out of a small difference. It’s good to know just how much of a difference makes a difference, though.
That said, neither Pew nor the Vox story mentions the very strong agreement between the different groups supporting opposing party candidates when the focus is on the relative magnitudes of agreement on aligned issues. Survey research typically focuses, of course, on percentages of responses to individual questions. Only measurement geeks like me wonder whether questions addressing a common theme could be related in a way that might convey more information. My curiosity was piqued, even though it is impossible to properly evaluate a model of this kind from the mere summary percentages. I knew if I found any correspondences they might just be accidents or coincidences, but I wanted to see what would happen.
So I typed up the text of the 18 issues concerning the seriousness of the problems being confronted in the US today, along with the percentages of registered voters saying each is a “very big” problem today. I put it all into SPSS and made a few technical checks to see if any major problems of interpretation would emerge from the nonlinear and ordinal percentages. The plots and correlations I did indicated that the same general results could be inferred from both the Pew percentages and their logit transformations.
While I was looking at a scatter plot of the Republican vs Democrat agreement percentages I noticed something interesting. I had been wondering if perhaps the striking differences in the groups’ willingness to say problems were serious might be a matter of relative emphases. Might the Republican supporters be less willing to find anything a big problem, but to nonetheless rank the issues in the same order as the Democrat supporters? This is, after all, exactly the kind of pattern commonly found in data from various surveys, assessments, and tests. No matter whether a respondent scores low overall, or scores high, the relative order of things stays the same.
Now, this is true in the kind of data I work with because considerable care is invested in composing questions that are intended to hang together like that. The idea is to deliberately vary the agreeability or difficulty of the questions so they all tap the same basic construct and demonstrably measure the same thing. When these kind of data are obtained, different questions measuring the same thing can be asked of different people without compromising the unit of measurement. That is, each different examinee or respondent can answer a unique set of questions and still have a measure comparable with anyone else’s. Like I said, this does not just happen by itself, but has to come about through a careful process of design and calibration. But the basic principles are well-established as being of longstanding and proven value across wide areas of research and practice.
So I was wondering if there might be one or more subsets of questions in the Pew data that would define the same problem magnitude dimension for supporters of both Republican and Democratic candidates. And as soon as I looked at the scatterplot of the percentages from the two groups, I saw that yes, indeed, there appeared to be four groups of issues that lined up along shared slopes. A color-coded version of that plot is in Figure 1.
The one statistical inference problem that emerged in examining these ordinal data concerns the yellow dot that is lowest and furthest to the left. At 8% agreement from the Republican supporters it was pulled away from the linear relation further than the other correspondences. When transformed into a log-odds unit, that single problematic difference lines up well with the other yellow dots further to the right.
The identity line in the figure shows where exact agreement between the two groups would be. That line marks out the connection between the same percentages of respondents agreeing an issue is a “very big” problem. We can see that the three green dots very nearly fall on that identity line. Just below them is a row of blue dots almost parallel with the identity line. Then there’s a third row of yellow dots further down, indicating more absolute disagreement between the two groups on these issues, but also showing a quite strong agreement as to their relative magnitudes within that group. Finally, there is another, red, line of dots in the lower right corner of the figure that marks out a more extreme range of absolute disagreement, but is also quite parallel to the identity line.

Figure 1 Initial plot of Republican vs Democrat Percentages agreement as to “Very Big” problems
Figures 2-5 below illustrate each of these groups of issues separately, giving further information on the problems and showing the regression lines and correlations for each contrast. The same colors have been retained to aid in seeing which groups of issues in Figure 1 are being shown.
The four areas of problems seem to me to correspond to issues of perceived major threats (Figure 2), accountability and access issues (Figure 3), equal opportunity issues (Figure 4), and systemic problems (Figure 5). Each of these content areas could be explored conceptually and qualitatively to assess whether some initial sense of a measured construct can be formed. If the by-person individual response data could be analyzed for fit to a proper measurement model, a much better job of determining the presence of invariant structure could be done.
But even without undertaking that work, these results already suggest a basis for productive conversations between the supposedly polarized groups. To start from the low-hanging fruit, the three problems the two groups agree on to within a couple of sampling errors (Figure 2) present topics of common agreement. Both Democrats and Republicans identify violent crime, the federal budget deficit, and drug addiction as matters of equally shared concern. The point is not that these are the highest rated problems for either group, but, rather, that they agree within the limits of statistical precision as to the extent that these are “very big” problems. It may be that setting shared priorities for addressing these problems could ground new relationships in that experience of having accomplished something productive together.
This new approach to building social capital might then proceed by taking up progressively more difficult areas of disagreement as to what “very big” problems are. Even though Republicans rate each area as less likely to be a “very big” problem, within each of the four groups of issues, they agree with Democrats as to their relative magnitudes. News like this might not sell a lot of ads, but it does offer hope for finding new ways of approaching relationships and crossing divides.

Figure 2.Republican vs Democrat areas of agreement as to “Very Big” problems

Figure 3 Republican vs Democrat areas of some disagreement as to “Very Big” problems
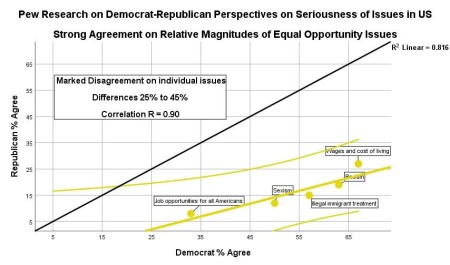
Figure 4 Republican vs Democrat areas of marked disagreement as to “Very Big” problems

Figure 5 Republican vs Democrat areas of fundamental disagreement as to “Very Big” problems

LivingCapitalMetrics Blog by William P. Fisher, Jr., Ph.D. is licensed under a Creative Commons Attribution-Noncommercial-No Derivative Works 3.0 United States License.
Based on a work at livingcapitalmetrics.wordpress.com.
Permissions beyond the scope of this license may be available at http://www.livingcapitalmetrics.com.
